Indicator generator
Pick a period. Get a smoothing indicator for MetaTrader 4, MetaTrader 5, TradingView, NinjaTrader or cTrader, with the source ready to paste. Free, no sign-up, nothing to install — the filter is designed in your browser and never leaves it.
The designer runs in your browser, so it needs JavaScript enabled. Everything below — what each number means, why a moving average lags, and how to test any indicator for look-ahead — reads the same without it.
LowPass 24 Balanced turnmarks.com
Why not just a moving average
A moving average is one weight pattern, picked for being cheap to compute in 1970. These are picked by solving for the response you asked for, and the difference is measurable with no market involved: set against an exponential average of the same lag, the filters on this page let through between a seventeenth and two thirds as much of the movement they were built to remove, depending where you set the dial. The generator measures it for the filter you have designed and prints the figure below, with your own numbers in it, rather than asking you to take this paragraph's word for it.
That is the one comparison that comes out this way, and the ones that do not are worth saying plainly. Match the two on smoothing instead — the same noise gain — and the average wins: these designs then lag between 1.3 and 7.4 times what it does. At equal lag they also pass more total random movement, 1.3 to 5 times as much, because rejecting one band hard is not the same as damping everything. It comes out that way off this page as well: set against a matched exponential average, the published FATL lags 1.2 times as much and passes 1.1 times the noise, and only its rejection of the fast band — 0.68 times the average's — is ahead.
So the claim is not that these are better moving averages. It is that for the lag you agree to pay, they reject what you asked them to reject one and a half to seventeen times harder, and that lag is matched on the centre of mass of the weights — which is what a moving average's lag is — rather than on a band chosen to flatter the comparison. That last point is also why the lag in the measured sentence is not quite the lag in the bill beside it: the bill prints the median delay across the band the filter keeps, the comparison uses the delay at the slowest frequencies, and the two sit within about a tenth of each other either way — exactly equal only for Smooth, which delays every frequency alike. An earlier version of this measurement matched on a band instead, and matched on nothing.
What the five numbers mean
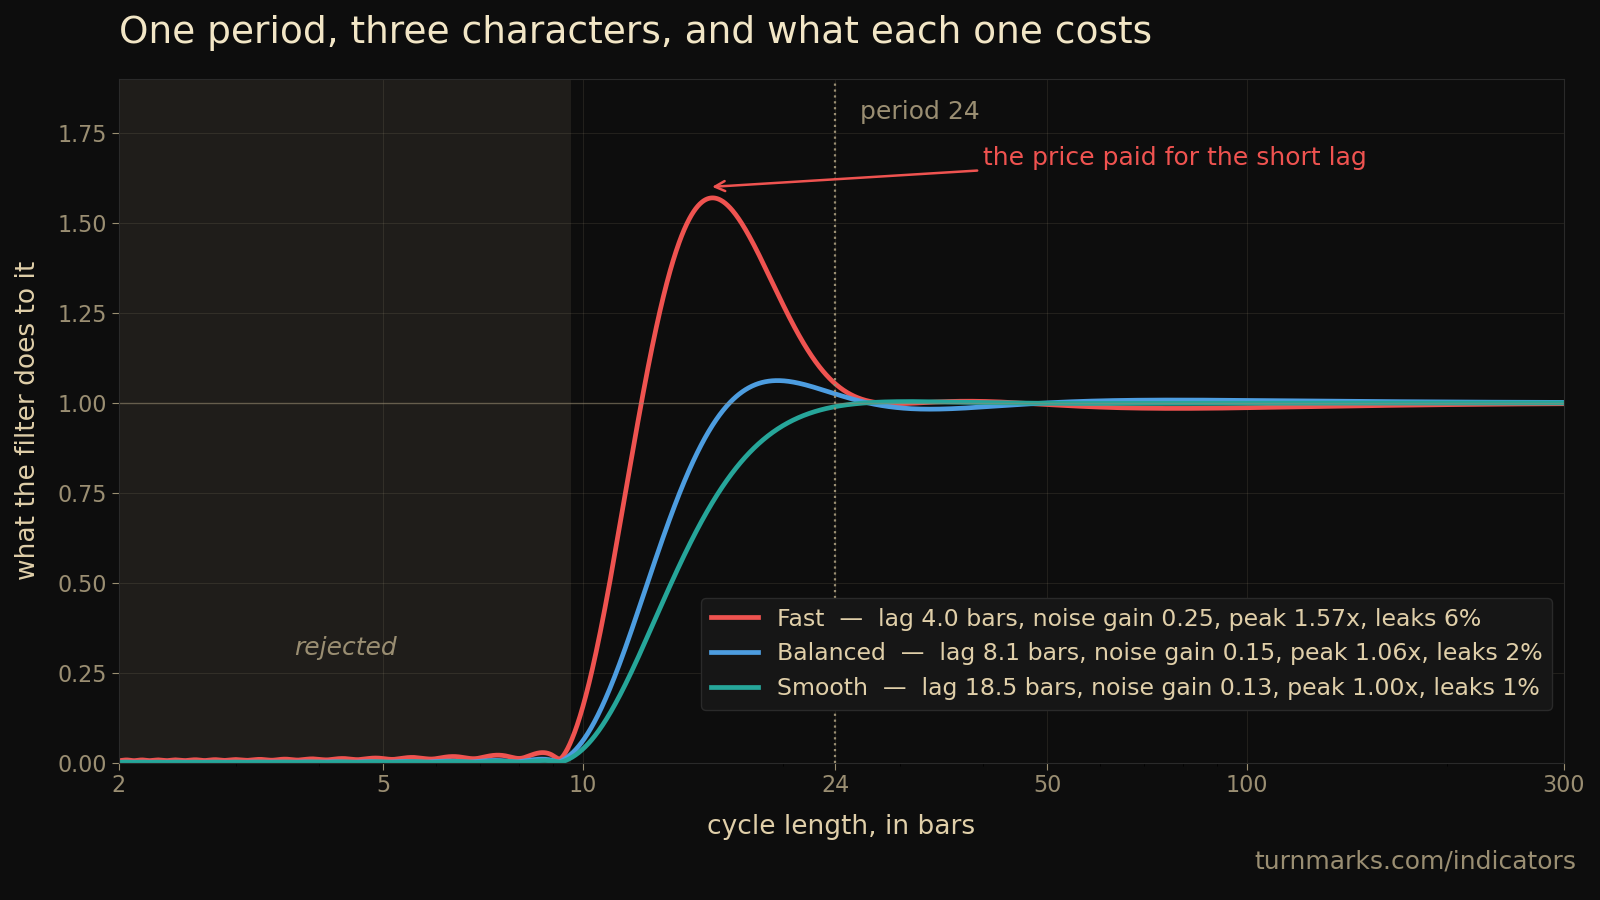
Sharper rejection is not the same as more smoothing, and it is not free: at that same lag these pass 1.3 to 5 times as much random movement as the average does. Every smoothing indicator makes some version of that trade and most show you only the good half of it. This one prints the whole bill — and the platforms all get the same coefficients, each in its own bar-indexing convention, each starting its line on the same bar.
| Lag | How many bars behind the price the line sits, measured on the movement the filter is built to keep. It is an average and not a constant: only the Smooth style delays every frequency equally, so for the other two the figure is a good description of the band that matters and an understatement everywhere else. |
|---|---|
| Taps | How many closed bars go into each point, and so how much history the indicator needs before it can draw anything. Past a period of about 80 this stops growing — the design is capped at 128 taps so it finishes quickly in a browser — and the generator says so when the cap binds. |
| Noise gain | What the filter does to the variance of random movement: the variance a unit-variance white input comes out with. Below 1 it damps, above 1 it amplifies. Few generators publish it, and it is the number that decides whether a low-lag design is usable or merely fast. |
| Peak gain | The most the filter magnifies anything, at any frequency — usually not in the band it keeps but in the transition just below it. A low-lag design buys its speed here: at 1.6x the line overshoots the top of a move by about a quarter of it and hangs above every printed price for a while. |
| Leaks | How much of the fast movement it was built to remove still gets through, at the single frequency it handles worst. Typical leakage is four to six times smaller than this figure. |
How the filter is designed
A moving average's lag is the centre of mass of its own weights, so when every weight is positive the only way to shorten it is to lean harder on the newest bars — which is the same thing as smoothing less. Letting some weights go negative buys a second dial, and that is the one this page turns.
The design is a least-squares fit. Over a grid of frequencies it asks for a response of 1 below your period, 0 above period ÷ 2.5, and a phase matching the delay you asked for, then finds the weights that come closest to all of it at once — with the gain at zero frequency constrained exactly to 1, so a flat price comes back as the same flat price and the line cannot drift off the chart.
That constraint is solved on its null space with a Householder QR, which is what makes the long filters trustworthy. The textbook shortcut — forming the normal equations — squares the condition number, and past about fifty taps it starts returning filters that look right and are not: finite numbers, weights summing to one, and a noise gain out by six orders of magnitude. The QR holds to 200 taps.
Ask for less lag and the solver will give it to you, at a price it also prints. Request zero delay on a 24-bar band and the answer comes back with a peak gain of 4.2, magnifying some movements fourfold; push further and the line becomes faster than the price and stops being smooth. Near-zero lag is a cost, not an impossibility. What no causal filter can do is reject a band perfectly, or delay every frequency by zero at once.
The five numbers are measured off the finished coefficients afterwards, never copied back from the request. The same arithmetic exists twice — in numpy here and in JavaScript in your browser — and a parity test checks the two against each other across the corners of the range before either one ships.
Non-repainting: how to tell whether an indicator uses future bars
There is a test you can run on any smoothed line, including ours, without reading a word of its source — but it is worth being exact about what it detects.
Look at where the line sits at the turns on the historical chart. A filter with meaningful lag turns after the price does, by roughly that lag. If a line that is supposed to be smoothing dozens of bars passes cleanly through the highs and lows instead, the usual reason is that it was computed with bars that had not happened yet — by running the filter forwards and backwards, or by revising old values as new ones arrive. Such a line is honest about history and unavailable in the present.
Two caveats, because the test is a proxy and not a proof. It flags look-ahead by way of lag, so a genuinely causal low-lag design — a Hull moving average, or this generator asked for a very short delay — sits close to the turns and fails a test it should pass; check its cost instead, since it will be paying in noise gain and overshoot. And a centred filter that simply refuses to plot until enough bars have closed passes the eyeball test while still using bars either side of each point. Repainting and look-ahead are related defects, not the same one.
Everything this page generates is a plain forward convolution over closed bars, so a value never changes once its bar has closed, and the line is late by about the number it prints. Like any indicator, its newest point moves with the bar that is still forming.
If you want measurements rather than lines, the pullback table and the level probabilities are what we publish.