CAD/JPY forecast
The forecast standing on CAD/JPY now
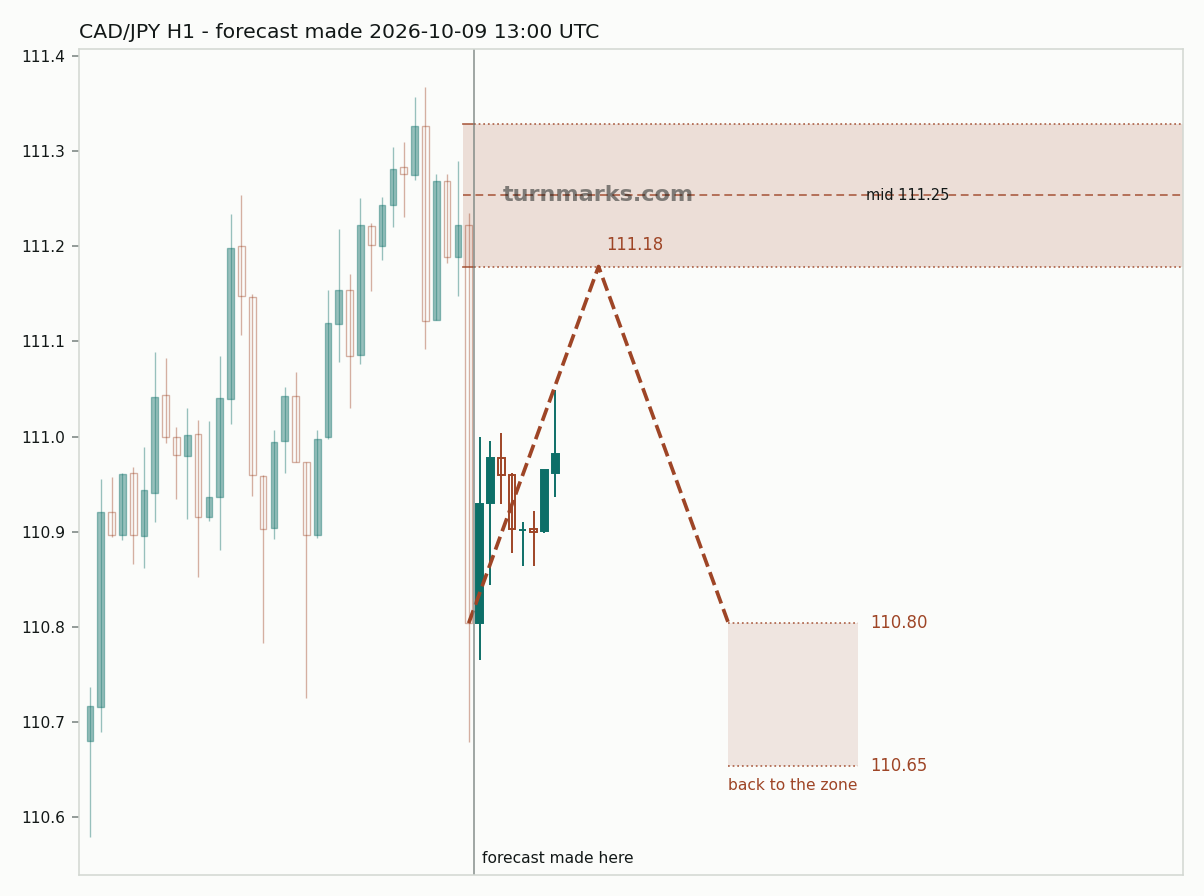
The reading takes the nearest live zone on each side of price, where there is one. Price is expected to come back into it, turn there, and travel on to the target band beyond it. It gives no date and no time.
Rebuilt before each session — 23:00, 06:00 and 12:00 UTC.
This forecast has its own page, and every CAD/JPY forecast is published as it is issued and again when it resolves: CAD/JPY feed - all markets - what else you can subscribe to.
How far a CAD/JPY pullback can go and still resume
The trend pulls back. Does it carry on, or has it turned? Measured on 3,859 CAD/JPY pullbacks since 2007 on hourly bars — 2,640 used to build the curve and 1,219 more it had never seen. Depth is measured against the swing that came before it, so a half is a pullback that has given back half the move.
| Pullback depth | Resumed |
|---|---|
| 25% of the move given back | 74% |
| 35% of the move given back | 64% |
| 50% of the move given back | 51% |
| 60% of the move given back | 42% |
| 70% of the move given back | 32% |
| 85% of the move given back | 18% |
| 100% of the move given back | 0% |
The halfway point for CAD/JPY is 51%: a pullback that has given back that much went on to a new extreme about half the time, so it is the depth at which this market stops being a trend that is resting and starts being a coin toss. Out of sample the curve landed 3.0 points from where it was built.
What this cannot tell you
It gives no date and no time.
If the question is really "will CAD/JPY reach this price", that is a different measurement and it has its own page: how often CAD/JPY reaches a level once it is set, by distance and within 4, 8, 24 or 48 hours.
Descriptive only, and not investment advice. Turnmarks publishes what has happened after past setups; nobody here knows what price will do next, and a page that told you otherwise would be selling you something.
The method, the calibration and the same question across 15 markets: the pullback study. Or every past marker on CAD/JPY and what followed it.
EUR/USD · GBP/USD · AUD/USD · USD/CHF · USD/JPY · EUR/JPY · GBP/JPY · AUD/JPY · CHF/JPY · XAU/USD · BTC/USD