BTC/USD forecast
The forecast standing on BTC/USD now
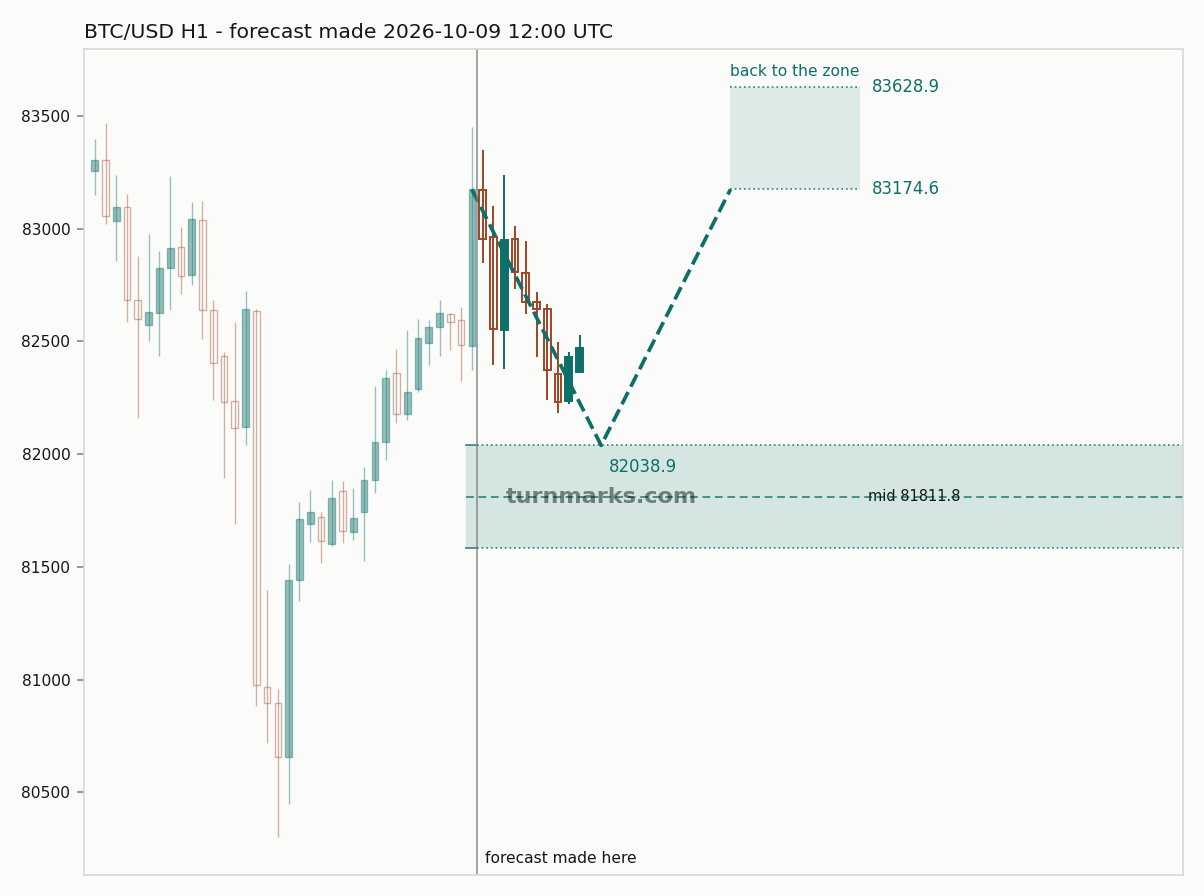
The reading takes the nearest live zone on each side of price, where there is one. Price is expected to come back into it, turn there, and travel on to the target band beyond it. It gives no date and no time.
Rebuilt before each session — 23:00, 06:00 and 12:00 UTC.
This forecast has its own page, and every BTC/USD forecast is published as it is issued and again when it resolves: BTC/USD feed - all markets - what else you can subscribe to.
This week so far, 5 to 11 October 2026
9 October the day: 81602.8 to 82371.9 (+769.1 dollars), range 1924.6
At the close 82592.9 to 82371.9 (-221.0 dollars), range 1212.1
Released during this session:
- US Michigan Consumer Sentiment Prel — 46.3 against a forecast of 47.6 (below forecast), previous 48.1
Seven down-trend bounce forecasts issued on 7 October ended at 11:00 UTC as dropped. Earlier in the session, a bounce call issued on 8 October failed at 08:00 UTC.
During the window, the preliminary US Michigan Consumer Sentiment reading printed at 46.3, below the forecasted 47.6.
A new upward bounce forecast was issued at 12:00 UTC targeting 83174.6. At the close at 20:00 UTC, it was still standing, with the price 802.7 dollars from the target.
Due in the next session:
- US Fed Collins Speech
Before the American session 82177.6 to 82584.1 (+406.5 dollars), range 530.0
A downward bounce forecast issued on 8 October failed during the session. Looking ahead to the American session, preliminary US Michigan Consumer Sentiment is scheduled for 14:00 UTC, with a forecast of 47.6.
A prior downward bounce forecast from 7 October was still standing at 11:00 UTC.
Due in the next session:
- US Michigan Consumer Sentiment Prel — forecast 47.6, previous 48.1
Before the European session 81688.7 to 82178.3 (+489.6 dollars), range 948.1
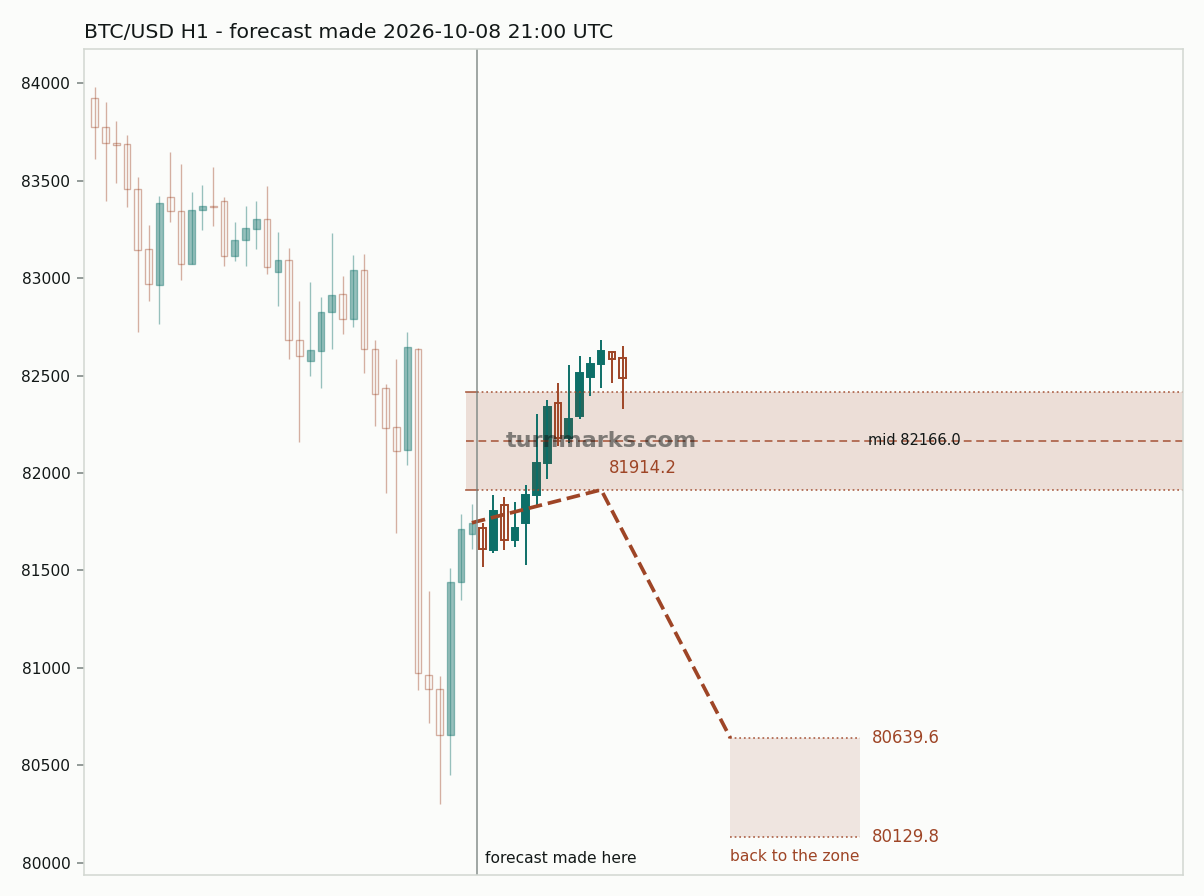
A downward forecast was issued at 21:00 UTC with a bounce leg targeting 80639.6 dollars. At the close of the window, the call was still standing, with the price 1538.7 dollars from the target band.
8 October the day: 83116.2 to 81612.8 (-1503.4 dollars), range 3172.0
At the close 82638.8 to 81441.9 (-1196.9 dollars), range 2426.5
Released during this session:
- EU ECB Monetary Policy Meeting Accounts
- US Initial Jobless Claims — 197K against a forecast of 200K (below forecast), previous 199K
- US Atlanta Fed GDPNow — 3.6% against a forecast of 3.7% (below forecast), previous 3.7%
- US Fed Musalem Speech
US Initial Jobless Claims came in at 197K against a forecast of 200K, while the Atlanta Fed GDPNow figure printed at 3.6% against an expected 3.7%. Speeches by Fed Waller and Fed Musalem were scheduled alongside the ECB Monetary Policy Meeting Accounts, with no readings available for those events.
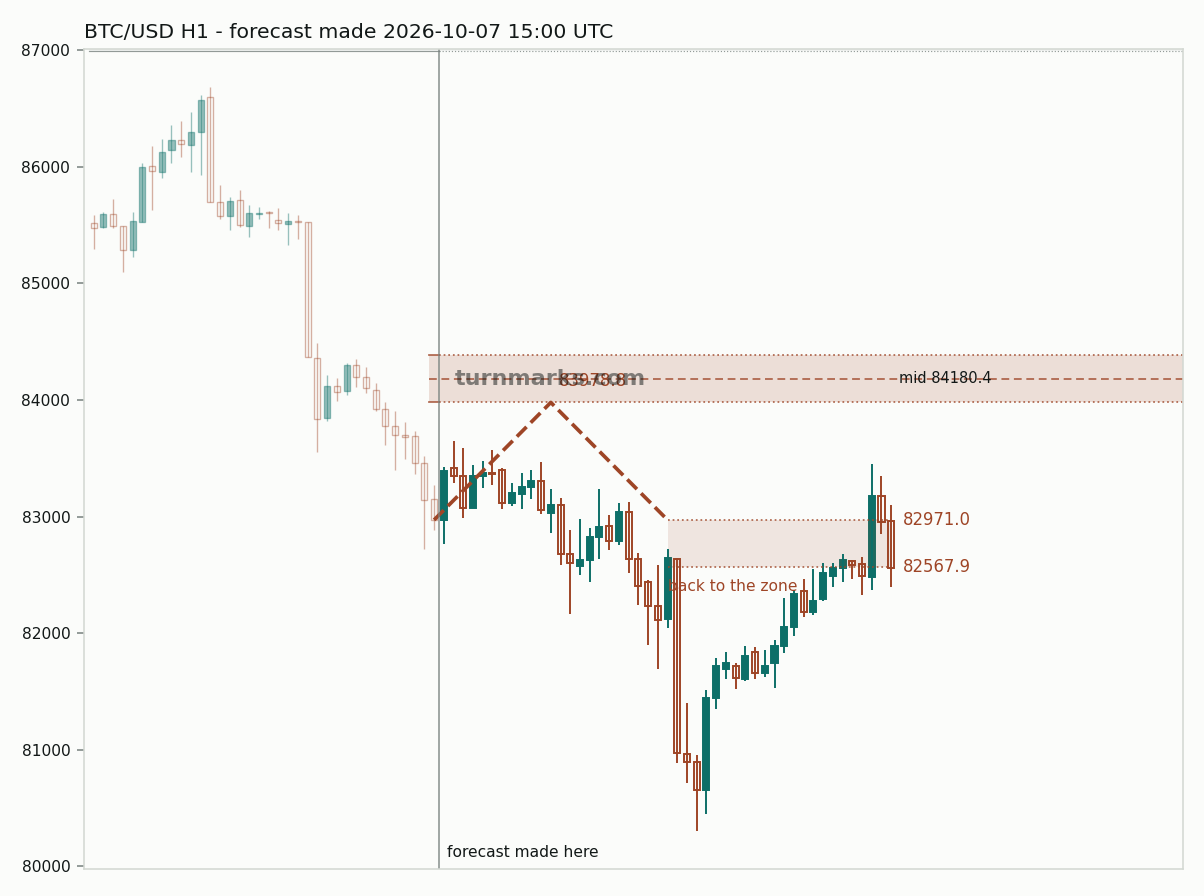
The downward forecast issued on 07 October for a bounce leg was still standing at 20:00 UTC, sitting 1256.7 dollars short of its 82971.0 target.
Before the American session 82573.4 to 82639.2 (+65.8 dollars), range 796.7
Released during this session:
- US Fed Waller Speech
A downward forecast issued on 7 October with a target of 82971.0 was still standing at 11:00 UTC, with the market 331.8 dollars from the target during a bounce leg.
Fed Waller was scheduled to speak at 08:30 UTC. Ahead in the American session, US Initial Jobless Claims are due at 12:30 UTC with an expected reading of 200K, followed by the Atlanta Fed GDPNow estimate at 15:00 UTC.
Due in the next session:
- EU ECB Monetary Policy Meeting Accounts
- US Initial Jobless Claims — forecast 200K, previous 199K
- US Atlanta Fed GDPNow — forecast 3.7%, previous 3.7%
Before the European session 83372.9 to 82599.5 (-773.4 dollars), range 1408.7
The downward bounce forecast issued at 15:00 UTC on 7 October was still standing at the end of the window, with the price closing 371.5 dollars from the target at 82971.0.
Ahead in the session, a speech by Fed Governor Waller is scheduled for 08:30 UTC.
Due in the next session:
- US Fed Waller Speech
7 October the day: 85540.8 to 83116.2 (-2424.6 dollars), range 2925.8
At the close 83695.7 to 83372.4 (-323.3 dollars), range 1086.5
Released during this session:
- US MBA 30-Year Mortgage Rate — 7.49%, previous 7.3%
- US EIA Crude Oil Stocks Change — -3.186M against a forecast of 1.7M (below forecast), previous 0.922M
- US EIA Gasoline Stocks Change — 0.382M against a forecast of -1.7M (above forecast), previous -1.684M
- US FOMC Minutes
Earlier in the day, a downward forecast issued on 5 October reached its 85250.9 target at 01:00 UTC on a bounce leg.
The FOMC Minutes were scheduled at 18:00 UTC, though no reading was available.
At 15:00 UTC, a new downward forecast was issued for a bounce leg with a zone between 83978.8 and 84382.0 aiming for a target of 82971.0. At the close, the forecast was standing, with price 401.4 dollars from the target.
Before the American session 84073.7 to 83695.6 (-378.1 dollars), range 956.4
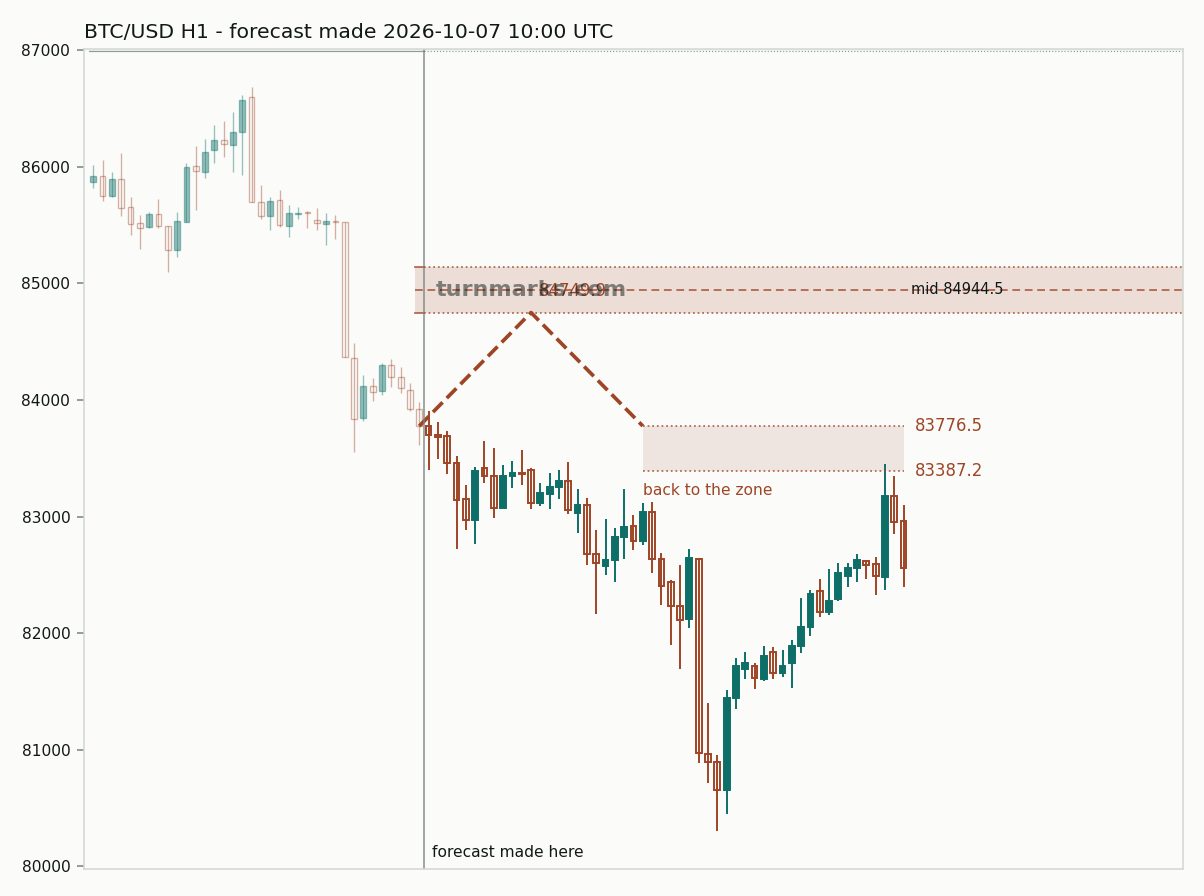
A downward forecast with a bounce leg was issued at 10:00 UTC, aiming for a target at 83776.5 from a zone between 84749.9 and 85139.2. At the close of the window, the price sat 80.9 dollars from the target band and the call had not resolved.
Ahead in the US session, the calendar includes EIA Crude Oil Stocks Change at 14:30 UTC, with a forecast of 1.9M.
Due in the next session:
- US MBA 30-Year Mortgage Rate
- US EIA Crude Oil Stocks Change — forecast 1.7M, previous 0.922M
- US EIA Gasoline Stocks Change — forecast -1.7M, previous -1.684M
Before the European session 85591.3 to 84072.0 (-1519.3 dollars), range 2108.3
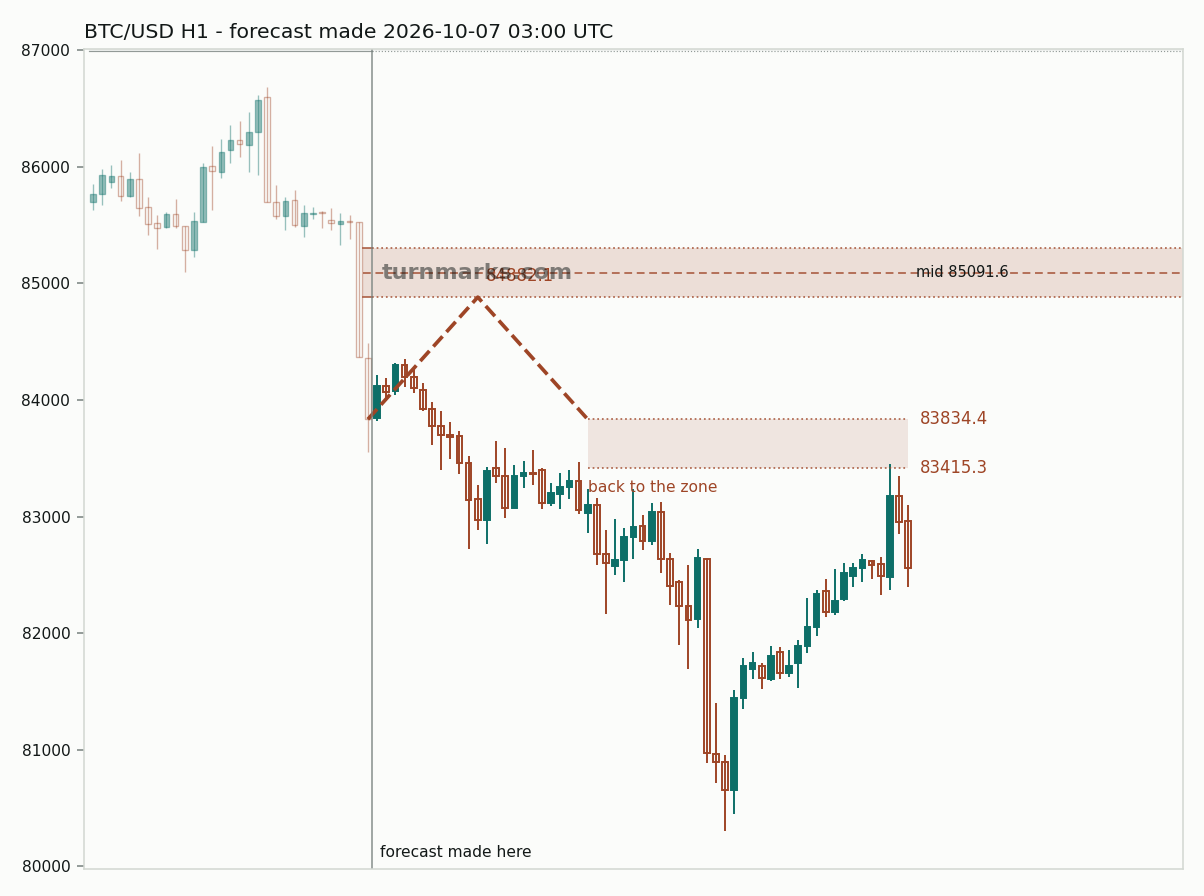
Resolved here: the forecast issued 5 October at 16:00 reached its invalidation level, 85250.9, at 01:00 UTC.
Released during this session:
- US API Crude Oil Stock Change — -2.09M, previous 1.019M
- US Fed Logan Speech
A down-trend forecast issued on 5 October reached its target during a bounce leg.
A new down-trend forecast was issued at 03:00 UTC with a target at 83834.4. At the close of the window, price stood 237.6 dollars from the target band.
6 October the day: 85872.8 to 85604.1 (-268.7 dollars), range 1587.7
At the close 86142.8 to 85602.8 (-540.0 dollars), range 1288.9
Released during this session:
- US ADP Employment Change Weekly — 23.75K, previous 20K
- US Exports — 315.2B, previous 310.7B
- US Balance of Trade — -105.6B against a forecast of -102B (below forecast), previous -92.8B
- US Imports — 420.8B, previous 403.6B
- US Fed Williams Speech
- US Fed Bowman Speech
- US Atlanta Fed GDPNow — 3.7% against a forecast of 3.7% (in line with forecast), previous 3.7%
- US EIA Short-Term Energy Outlook
- US Fed Schmid Speech
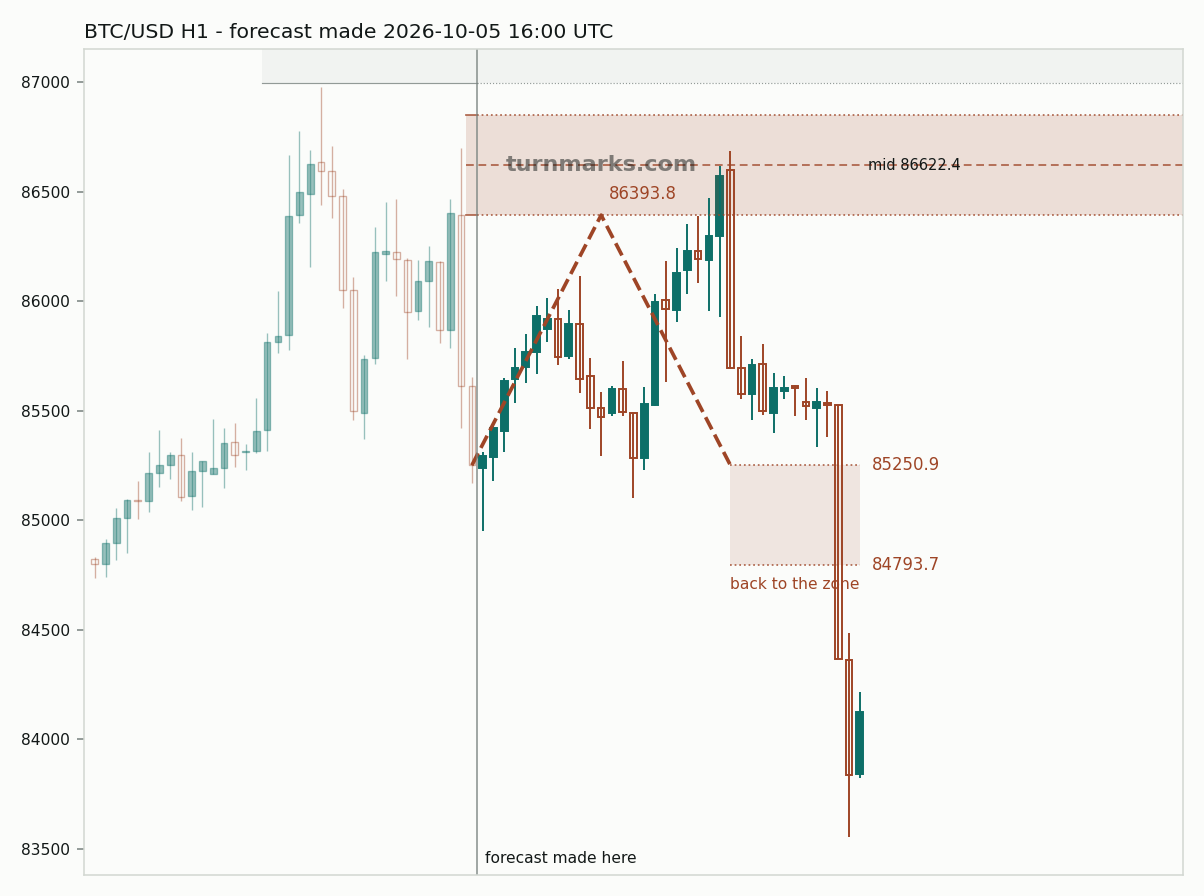
At the close, a downward bounce forecast issued on 5 October had not resolved, sitting 351.9 dollars from its target at 85250.9.
In US economic data, the Balance of Trade came in at -105.6B against a forecast of -102B, while the Atlanta Fed GDPNow reading matched expectations at 3.7%. Earlier in the day, Eurozone Retail Sales MoM landed at 0.1% against a 0.2% forecast.
Due in the next session:
- US API Crude Oil Stock Change
- US Fed Logan Speech
Before the American session 85599.3 to 86127.6 (+528.3 dollars), range 1142.1
Released during this session:
- EU Retail Sales MoM — 0.1% against a forecast of 0.2% (below forecast), previous -0.6%
A bounce forecast targeting 85250.9 in a downward trend had not resolved by the close of the window at 11:00 UTC, with price standing 876.7 dollars above the target.
During the session, Eurozone retail sales rose 0.1% against a 0.2% expected increase.
Ahead in the US session, US trade balance figures are due at 12:30 UTC alongside weekly ADP employment data at 12:15 UTC, with speeches from Federal Reserve officials Williams and Bowman scheduled for later in the afternoon.
Due in the next session:
- US ADP Employment Change Weekly
- US Exports
- US Balance of Trade — forecast -102B, previous -92.8B
- US Imports
- US Fed Williams Speech
- US Fed Bowman Speech
- US Atlanta Fed GDPNow — forecast 3.7%, previous 3.7%
- US EIA Short-Term Energy Outlook
Before the European session 85700.4 to 85598.0 (-102.4 dollars), range 825.6
At the close of the window, a downward forecast issued at 16:00 UTC on 5 October remained active. The call stems from a bounce leg with a zone between 86393.8 and 86851.0 and a target of 85250.9, with price sitting 347.1 dollars from that target level at 05:00 UTC.
Due in the next session:
- EU Retail Sales MoM — forecast 0.2%, previous -0.6%
5 October the day: 85845.4 to 85933.6 (+88.2 dollars), range 2026.4
At the close 86090.8 to 85695.6 (-395.2 dollars), range 1745.5
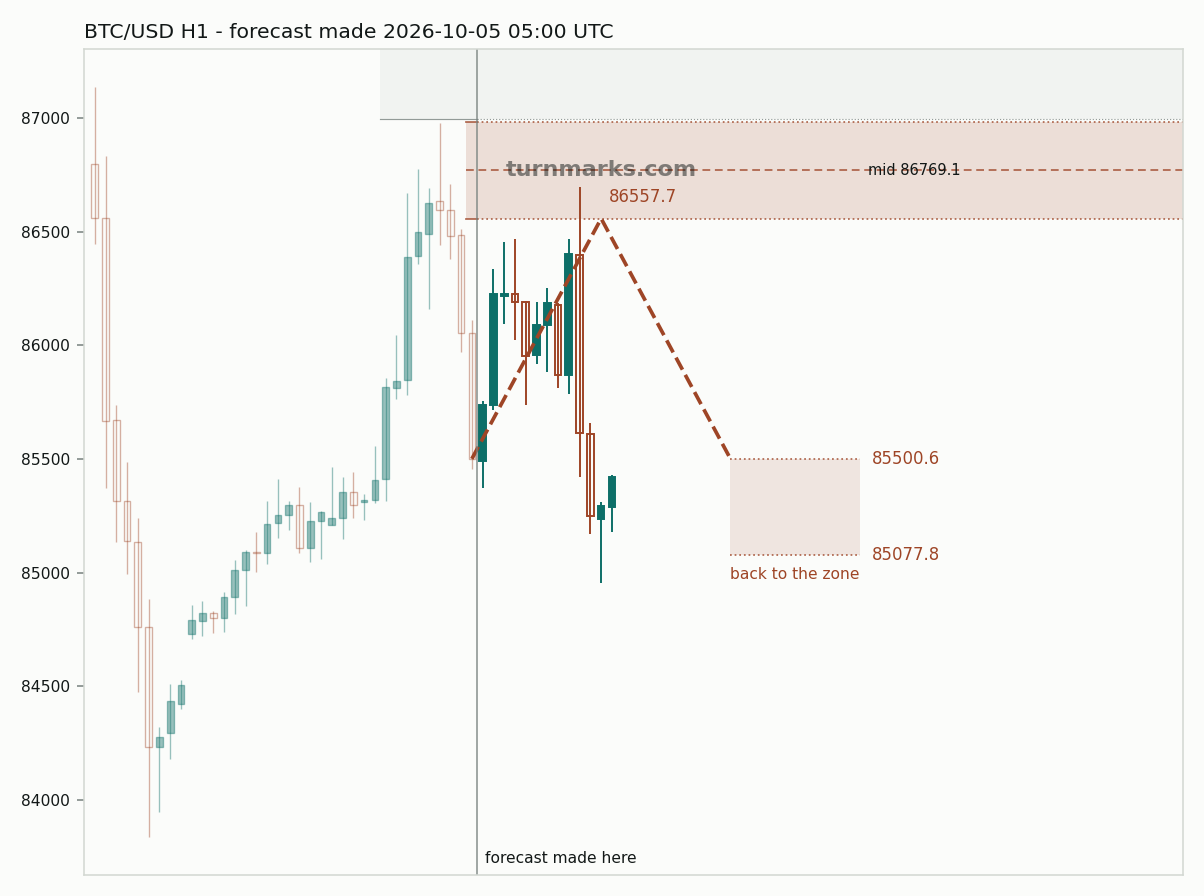
Resolved here: the forecast issued 5 October at 05:00 reached its invalidation level, 85500.6, at 15:00 UTC.
Released during this session:
- US ISM Services PMI — 54.9 against a forecast of 55 (below forecast), previous 55.4
A downward forecast issued at 05:00 UTC reached its target at 15:00 UTC on a bounce leg. Earlier in the day, a forecast from 00:00 UTC reached its target at 03:00 UTC, while an earlier call issued on 2 October ended failed at 23:00 UTC on 4 October.
The US ISM Services PMI was reported at 14:00 UTC, landing at 54.9 against a forecast of 55.
By the close, a fresh downward forecast issued at 16:00 UTC on a bounce leg had not resolved, remaining 444.7 points short of its target.
Before the American session 85491.5 to 86091.3 (+599.8 dollars), range 1093.9
Ahead of the American session, the major US ISM Services PMI release is scheduled for 14:00 UTC, with an expected reading of 55.
A downward forecast looking for a bounce into the 86557.7 to 86980.5 zone toward a 85500.6 target was issued at 05:00 UTC. At the 11:00 UTC close, it remained live and stood 590.7 dollars from the target.
Due in the next session:
- US ISM Services PMI — forecast 55, previous 55.4
Before the European session 85411.0 to 85500.6 (+89.6 dollars), range 1662.3
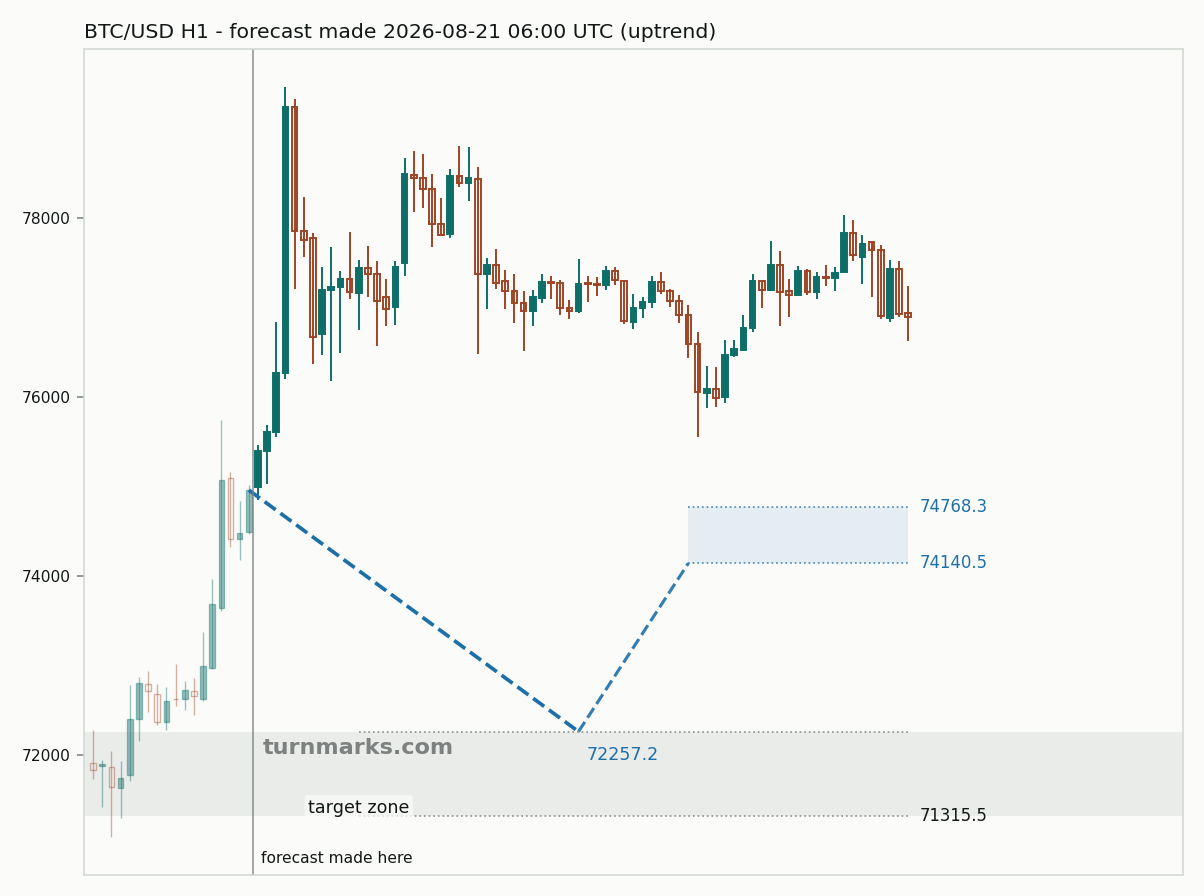
Resolved here: the forecast issued 5 October at 00:00 reached its invalidation level, 86018.1, at 03:00 UTC.
A downward forecast issued on 2 October ended in a failure on a bounce leg during the early hours of the window. A second downward call, issued at the start of 5 October, reached its target on a bounce leg shortly after.
At the close, an older upward forecast dating from 21 August on a reversal leg was still standing, with price finishing 13243.4 dollars away from its target band.
How the week stands so far
| Forecasts that ended this week | 12 |
|---|---|
| Reached the level they named | 3 |
| Ended without reaching it | 9 |
| Issued this week | 12 |
| Still standing | 1 |
Earlier weeks
- 28 September to 4 October 2026 — 13 forecasts ended, 6 at the level they named
How far a BTC/USD pullback can go and still resume
The trend pulls back. Does it carry on, or has it turned? Measured on 2,534 BTC/USD pullbacks since 2012 on hourly bars — 1,885 used to build the curve and 649 more it had never seen. Depth is measured against the swing that came before it, so a half is a pullback that has given back half the move.
| Pullback depth | Resumed |
|---|---|
| 25% of the move given back | 71% |
| 35% of the move given back | 64% |
| 50% of the move given back | 50% |
| 60% of the move given back | 43% |
| 70% of the move given back | 32% |
| 85% of the move given back | 15% |
| 100% of the move given back | 0% |
The halfway point for BTC/USD is 50%: a pullback that has given back that much went on to a new extreme about half the time, so it is the depth at which this market stops being a trend that is resting and starts being a coin toss. Out of sample the curve landed 1.7 points from where it was built.
What this cannot tell you
It gives no date and no time.
If the question is really "will BTC/USD reach this price", that is a different measurement and it has its own page: how often BTC/USD reaches a level once it is set, by distance and within 4, 8, 24 or 48 hours.
Descriptive only, and not investment advice. Turnmarks publishes what has happened after past setups; nobody here knows what price will do next, and a page that told you otherwise would be selling you something.
The method, the calibration and the same question across 15 markets: the pullback study. Or every past marker on BTC/USD and what followed it.
EUR/USD · GBP/USD · AUD/USD · USD/CHF · USD/JPY · EUR/JPY · GBP/JPY · AUD/JPY · CHF/JPY · CAD/JPY · XAU/USD