US30 forecast
The forecast standing on US30 now
The reading takes the nearest live zone on each side of price, where there is one. Price is expected to come back into it, turn there, and travel on to the target band beyond it. It gives no date and no time.
Rebuilt before each session — 23:00, 06:00 and 12:00 UTC.
This forecast has its own page, and every US30 forecast is published as it is issued and again when it resolves: US30 feed - all markets - what else you can subscribe to.
This week so far, 5 to 11 October 2026
9 October the day: 51256.2 to 51751.8 (+495.6 points), range 554.3
At the close 51316.2 to 51751.8 (+435.6 points), range 554.3
Released during this session:
- US Michigan Consumer Sentiment Prel — 46.3 against a forecast of 47.6 (below forecast), previous 48.1
The preliminary US Michigan Consumer Sentiment reading landed at 14:00 UTC at 46.3, against a forecast of 47.6.
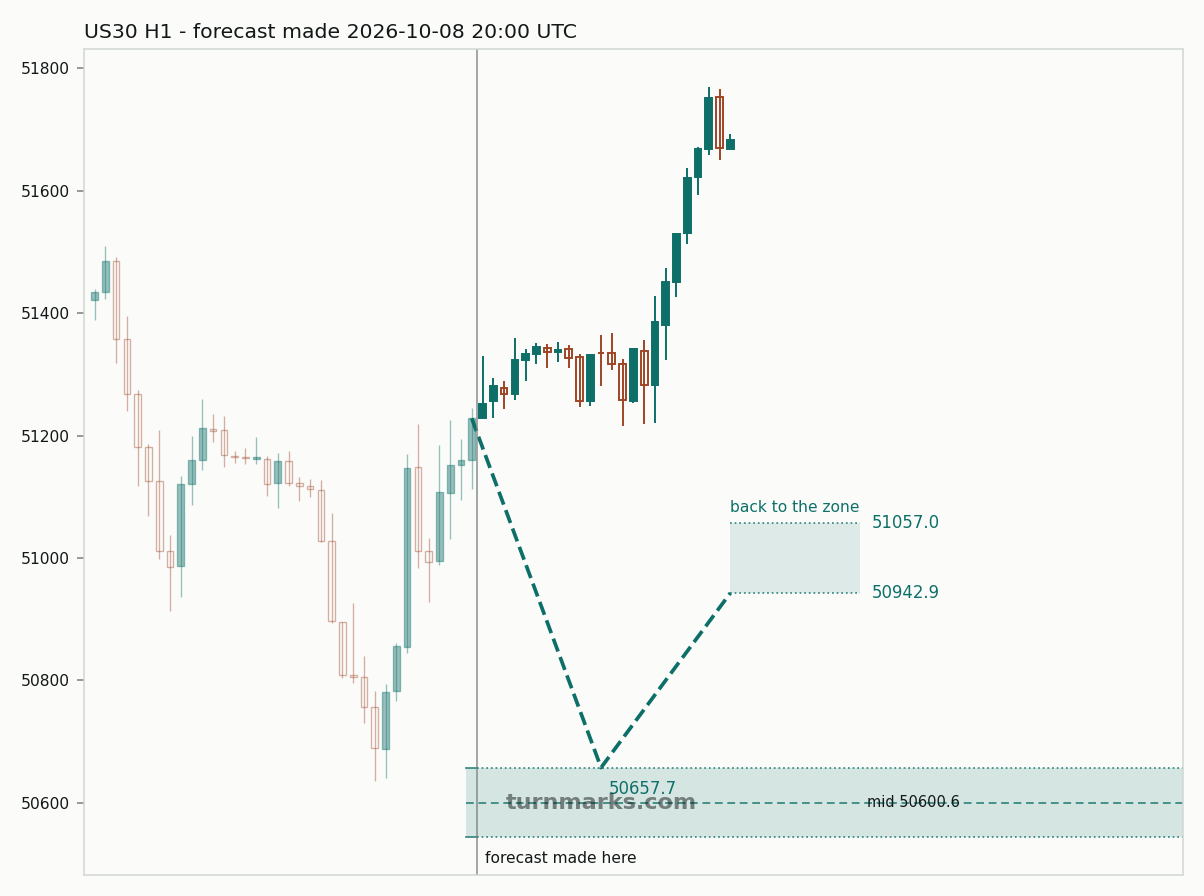
At the close, an upward bounce forecast issued on 8 October was still standing, with price finishing 808.9 points away from its target of 50942.9. A speech by Fed Collins was scheduled at 20:00 UTC.
Due in the next session:
- US Fed Collins Speech
Before the American session 51341.1 to 51317.2 (-23.9 points), range 121.1
Ahead of the American session, the preliminary Michigan Consumer Sentiment index is scheduled for release at 14:00 UTC, with a forecast of 47.6 following a previous reading of 48.1.
At 11:00 UTC, the bounce forecast issued at 20:00 UTC on 8 October had not resolved. Price finished the window 314.7 points above its target level of 50942.9, with the entry zone located between 50543.6 and 50657.7.
Due in the next session:
- US Michigan Consumer Sentiment Prel — forecast 47.6, previous 48.1
Before the European session 51228.7 to 51339.2 (+110.5 points), range 130.4
A bounce forecast was issued at the start of the window at 20:00 UTC, pointing upward with a target at 50942.9. At the close of the session, the forecast was still standing, with the price 396.3 points from the target band.
8 October the day: 51165.5 to 51251.7 (+86.2 points), range 694.1
At the close 50688.5 to 51160.1 (+471.6 points), range 584.3
Released during this session:
- EU ECB Monetary Policy Meeting Accounts
- US Initial Jobless Claims — 197K against a forecast of 200K (below forecast), previous 199K
- US Atlanta Fed GDPNow — 3.6% against a forecast of 3.7% (below forecast), previous 3.7%
- US Fed Musalem Speech
Earlier in the day, a pair of downward bounce forecasts issued on 7 October reached their targets at 06:00 UTC, with the call issued at 14:00 hitting 51012.1 and the call at 15:00 reaching 50984.6.
During the session, US Initial Jobless Claims printed at 197K against a 200K forecast, while the Atlanta Fed GDPNow estimate landed at 3.6% against an expected 3.7%.
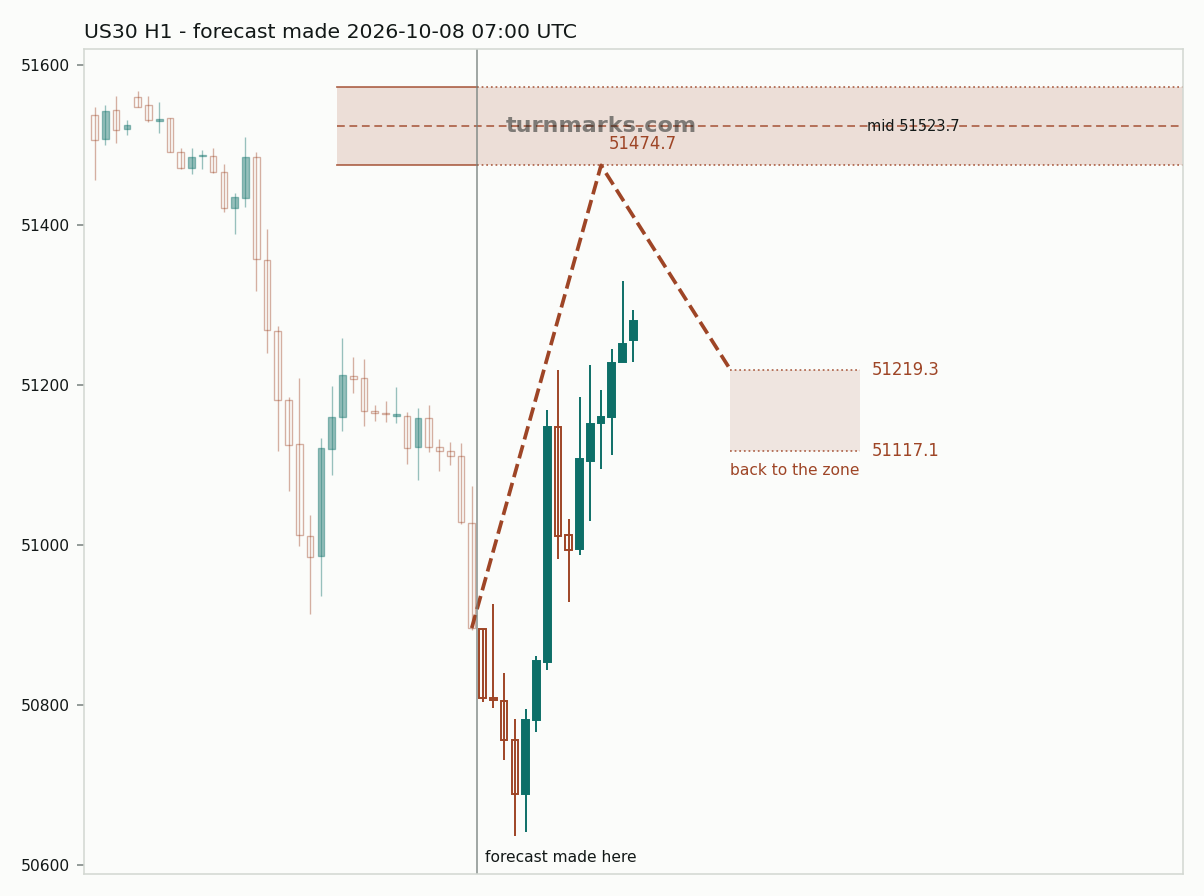
At the close, a downward bounce forecast issued at 07:00 UTC had not resolved, with price finishing 8.9 points away from its 51219.3 target.
Before the European session 51167.2 to 51112.0 (-55.2 points), range 117.0
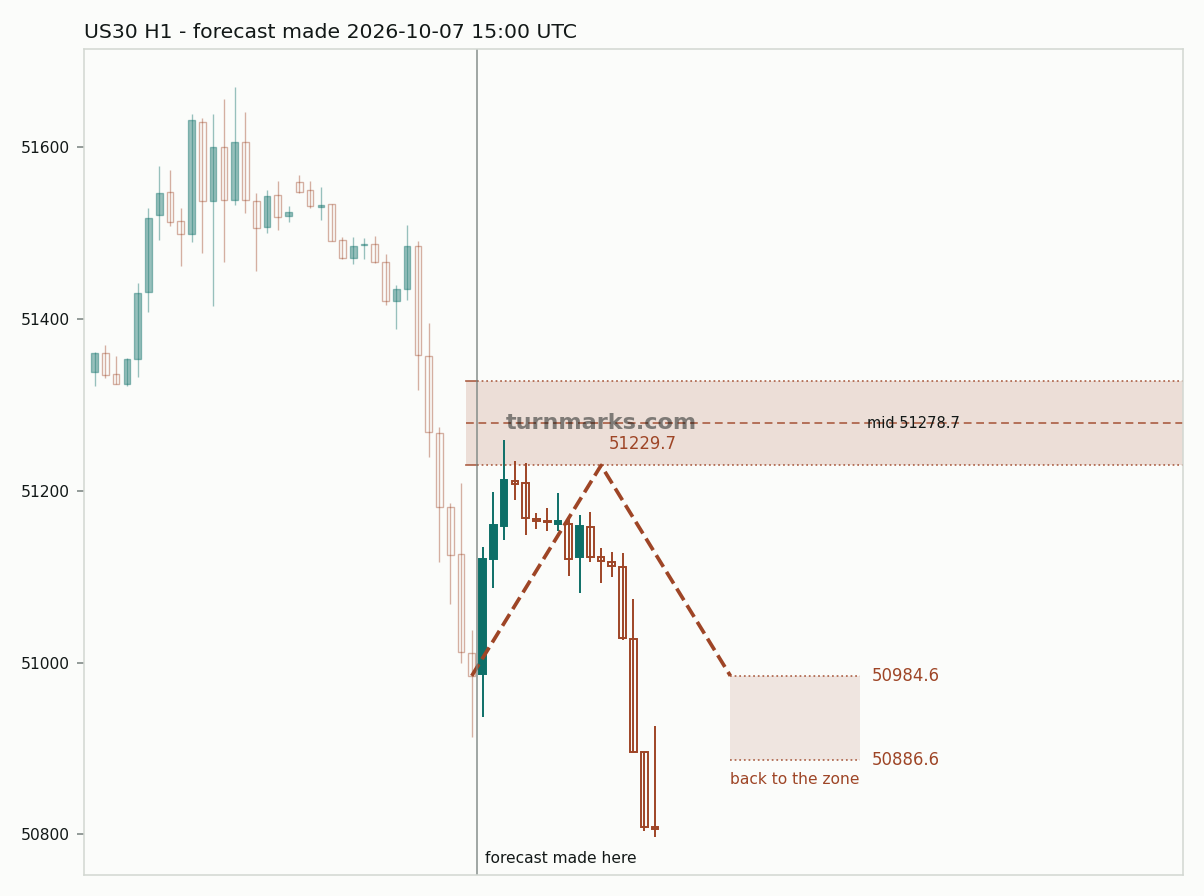
At 05:00 UTC, the downward bounce forecast issued on 7 October remained standing, with the close sitting 127.4 points above its 50984.6 target band. The call expects a move into the 51229.7–51327.7 zone before turning lower.
Looking ahead, a speech by Fed Waller is scheduled for 08:30 UTC.
Due in the next session:
- US Fed Waller Speech
What followed: that forecast reached its invalidation level of 50984.6 on 8 October at 06:00 UTC.
7 October the day: 51560.0 to 51164.6 (-395.4 points), range 654.3
At the close 51267.4 to 51168.2 (-99.2 points), range 360.8
Released during this session:
- US MBA 30-Year Mortgage Rate — 7.49%, previous 7.3%
- US EIA Crude Oil Stocks Change — -3.186M against a forecast of 1.7M (below forecast), previous 0.922M
- US EIA Gasoline Stocks Change — 0.382M against a forecast of -1.7M (above forecast), previous -1.684M
- US FOMC Minutes
Four forecasts ended during the session. At 11:00 UTC, a bounce forecast issued on 6 October ended as a failure. At 12:00 UTC, three bounce forecasts issued on 5 October dropped out after price failed to reach their targets.
The scheduled FOMC Minutes were released at 18:00 UTC, for which no reading is available. Earlier in the session, US EIA Crude Oil Stocks Change was reported at -3.186M against a forecast of 1.7M.
A downward bounce forecast was issued at 15:00 UTC towards a target of 50984.6. At the close, the index stood 183.6 points from that target band.
Before the American session 51487.0 to 51268.4 (-218.6 points), range 270.1
US30 dropped 218.6 points during the session across a 270.1-point range.
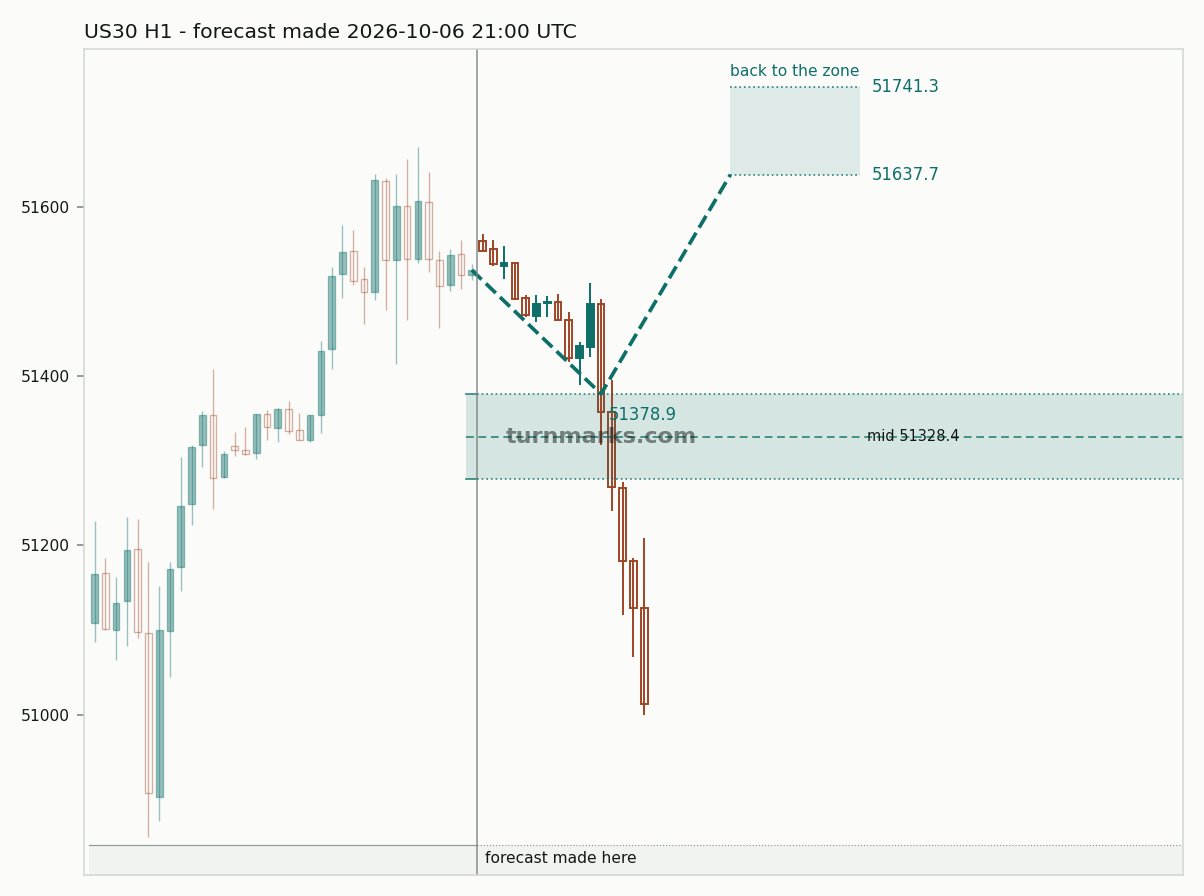
An upward bounce forecast issued on 6 October at 21:00 UTC remained standing at 11:00 UTC. The call projects a move towards 51637.7 from the 51277.8–51378.9 zone, with the close sitting 369.3 points short of the target band.
The upcoming US calendar includes the MBA 30-Year Mortgage Rate at 11:00 UTC, followed by EIA Crude Oil Stocks Change at 14:30 UTC.
Due in the next session:
- US MBA 30-Year Mortgage Rate
- US EIA Crude Oil Stocks Change — forecast 1.7M, previous 0.922M
- US EIA Gasoline Stocks Change — forecast -1.7M, previous -1.684M
Before the European session 51519.6 to 51487.5 (-32.1 points), range 104.0
Released during this session:
- US API Crude Oil Stock Change — -2.09M, previous 1.019M
- US Fed Logan Speech
A bounce forecast was issued during the session at 21:00 UTC, setting an upside target of 51637.7 off the 51277.8–51378.9 zone. At the close of the window, the forecast had not resolved, with price sitting 150.2 points away from the target band.
During the overnight window, the API Crude Oil Stock Change print landed at -2.09M, and Fed Logan delivered a scheduled speech.
6 October the day: 51317.4 to 51525.1 (+207.7 points), range 368.8
At the close 51499.0 to 51518.7 (+19.7 points), range 255.6
Released during this session:
- US ADP Employment Change Weekly — 23.75K, previous 20K
- US Exports — 315.2B, previous 310.7B
- US Balance of Trade — -105.6B against a forecast of -102B (below forecast), previous -92.8B
- US Imports — 420.8B, previous 403.6B
- US Fed Williams Speech
- US Fed Bowman Speech
- US Atlanta Fed GDPNow — 3.7% against a forecast of 3.7% (in line with forecast), previous 3.7%
- US EIA Short-Term Energy Outlook
- US Fed Schmid Speech
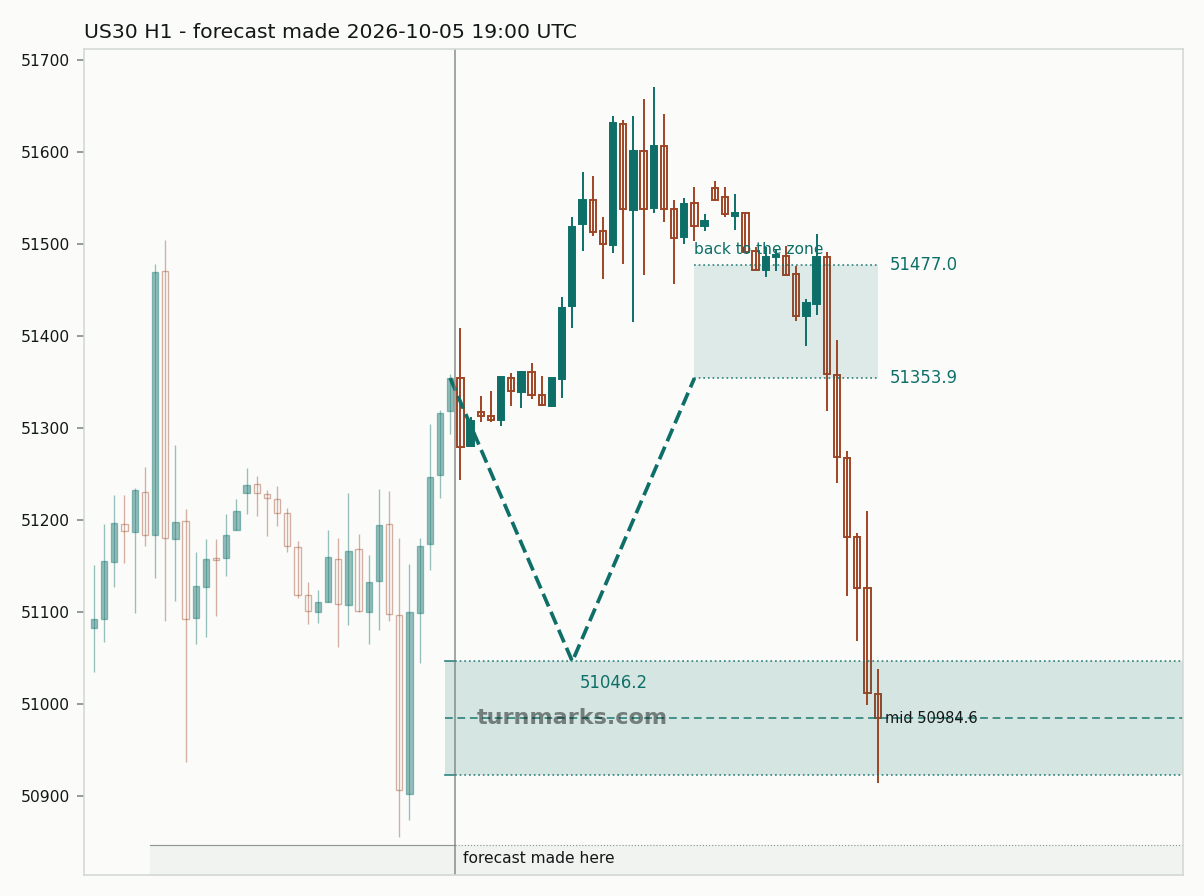
At the close, a bounce forecast issued on 5 October remained standing, with 164.8 points remaining to its 51353.9 target band.
Among scheduled US economic releases, the Balance of Trade print landed at -105.6B against an expected -102B, while the Atlanta Fed GDPNow reading matched forecasts at 3.7%. Earlier in the day, EU Retail Sales MoM showed 0.1% growth against a 0.2% forecast.
Due in the next session:
- US API Crude Oil Stock Change
- US Fed Logan Speech
Before the American session 51323.9 to 51499.4 (+175.5 points), range 256.0
Released during this session:
- EU Retail Sales MoM — 0.1% against a forecast of 0.2% (below forecast), previous -0.6%
At 11:00 UTC, an upward bounce forecast issued on 5 October remained standing, targeting 51353.9 points and finishing the window 145.5 points from the target band.
During the session, EU Retail Sales MoM landed at 0.1% against a forecast of 0.2%. Scheduled events ahead in the US session include US Balance of Trade at 12:30 UTC (forecast -102B) and weekly ADP Employment Change at 12:15 UTC, followed by speeches from Fed officials Williams at 13:05 UTC and Bowman at 14:45 UTC.
Due in the next session:
- US ADP Employment Change Weekly
- US Exports
- US Balance of Trade — forecast -102B, previous -92.8B
- US Imports
- US Fed Williams Speech
- US Fed Bowman Speech
- US Atlanta Fed GDPNow — forecast 3.7%, previous 3.7%
- US EIA Short-Term Energy Outlook
Before the European session 51280.4 to 51324.4 (+44.0 points), range 90.5
An upward bounce forecast issued at 19:00 UTC on 5 October remained standing at the close of the session. Price finished 29.5 points from the 51353.9 target band, with the forecast zone set between 50923.1 and 51046.2.
Ahead in the session, European retail sales data is scheduled for release at 09:00 UTC.
Due in the next session:
- EU Retail Sales MoM — forecast 0.2%, previous -0.6%
5 October the day: 51228.8 to 51307.4 (+78.6 points), range 553.1
At the close 51133.7 to 51279.5 (+145.8 points), range 553.1
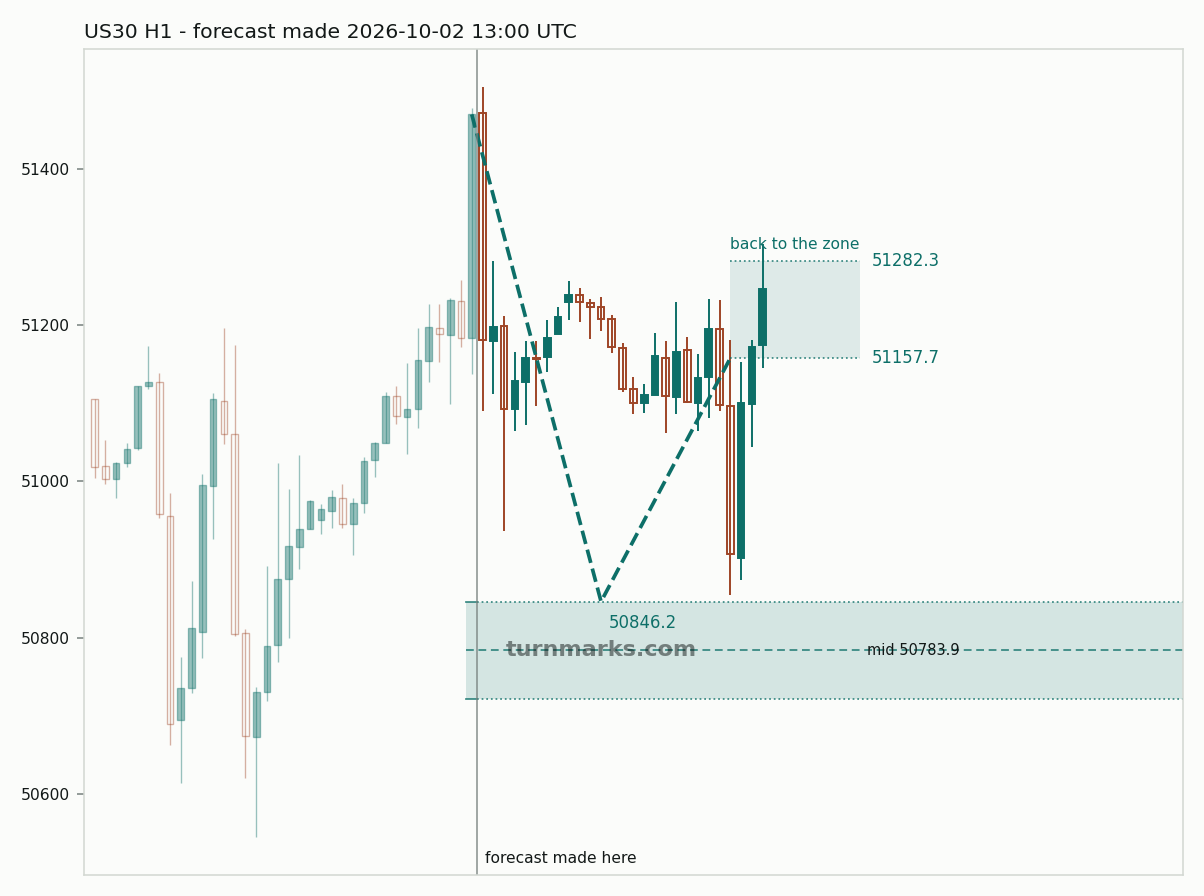
Resolved here: the forecast issued 2 October at 13:00 reached its invalidation level, 51157.7, at 14:00 UTC.
Released during this session:
- US ISM Services PMI — 54.9 against a forecast of 55 (below forecast), previous 55.4
A bounce forecast issued on 2 October reached its target during the session. Around the same time, the US ISM Services PMI print landed at 54.9, slightly below the 55 forecast.
A fresh upward bounce forecast was issued late in the session, calling for a return to 51353.9. At the close, price sat 74.4 points short of the target band.
Before the American session 51100.3 to 51132.2 (+31.9 points), range 167.1
Major economic news lies ahead in the coming session, with the US ISM Services PMI scheduled for release at 14:00 UTC with a forecast of 55.
An upward bounce forecast issued on 2 October was still standing at 11:00 UTC. The call targets 51157.7, leaving the index 25.5 points short at the end of the window.
Due in the next session:
- US ISM Services PMI — forecast 55, previous 55.4
How the week stands so far
| Forecasts that ended this week | 9 |
|---|---|
| Reached the level they named | 3 |
| Ended without reaching it | 6 |
| Issued this week | 9 |
| Still standing | 1 |
Earlier weeks
- 28 September to 4 October 2026 — 9 forecasts ended, 1 at the level they named
Why there is no pullback curve for US30
Every other instrument here carries one: how often the trend resumed from each depth of pullback. US30 does not, because the study has not been run on it. That is not a verdict: nothing here has tested whether the pullback law holds on an index, and publishing a curve borrowed from currency pairs would be presenting an untested guess as a measurement.
What is above still holds: the same feed, the same markers and the same measurement as every other page here.
What this cannot tell you
It gives no date and no time.
If the question is really "will US30 reach this price", that is a different measurement and it has its own page: how often US30 reaches a level once it is set, by distance and within 4, 8, 24 or 48 hours.
Descriptive only, and not investment advice. Turnmarks publishes what has happened after past setups; nobody here knows what price will do next, and a page that told you otherwise would be selling you something.
The method, the calibration and the same question across 15 markets: the pullback study. Or every past marker on US30 and what followed it.
EUR/USD · GBP/USD · AUD/USD · USD/CHF · USD/JPY · EUR/JPY · GBP/JPY · AUD/JPY · CHF/JPY · CAD/JPY · XAU/USD · BTC/USD